
Pour optimiser une infrastructure mondiale, vous avez besoin de données granulaires sur qui consomme votre contenu. Le Demandes de traduction Le tableau de bord sert d'unité de télémétrie centrale. Il suit chaque instance où le moteur MultiLipi sert une page traduite, agrégeant ces données en visualisations de séries chronologiques. Cela vous permet de distinguer les langues passives (activées mais inutilisées) des marchés actifs (forte consommation), validant ainsi votre retour sur investissement en localisation.
Ce guide détaille la navigation et l'interprétation de vos données de trafic linguistique.
2. L'architecture du tableau de bord
Comprendre les signaux.
A. Requêtes de traduction totales (La charge agrégée)
Affichage : Un grand indicateur numérique en haut du panneau.
Définition : Cela représente le nombre total d'« appels de traduction » effectués à notre API sur toutes les langues.
Note technique : Un appel est déclenché chaque fois qu'un visiteur charge une page dans une langue cible (via LiveJS, sous-répertoire ou sous-domaine). Il est un proxy direct pour "Vues de page localisées".
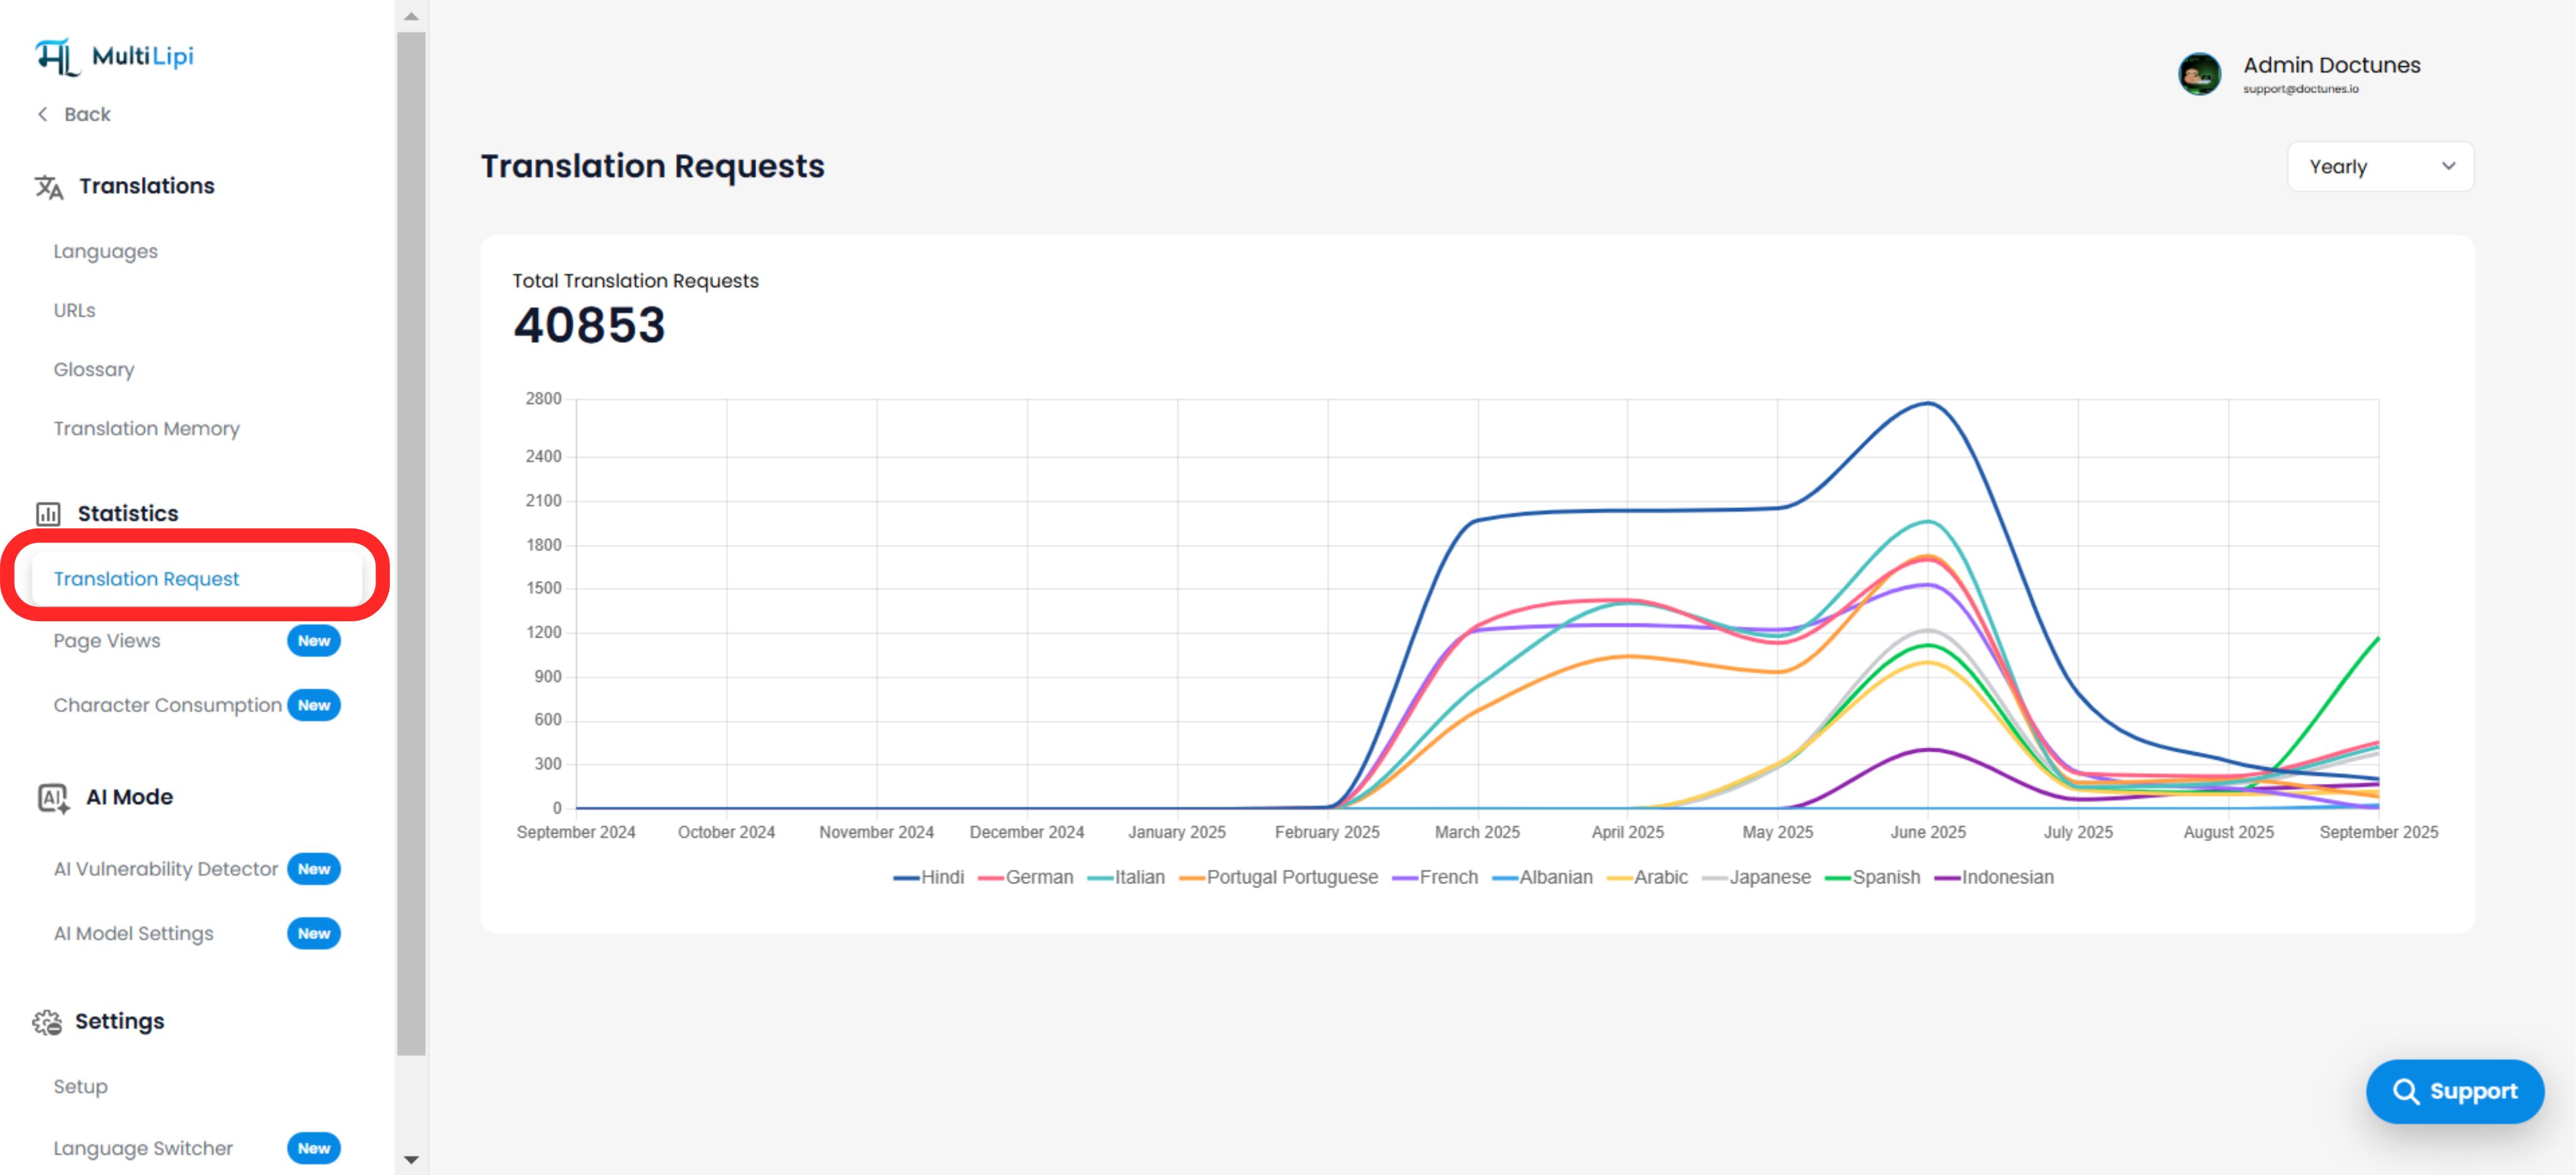
B. Séries chronologiques par langue (Le graphique de tendance)
Visualisation : Un graphique linéaire multicolore suivant les performances au fil du temps.
Axe Y (Volume) : Nombre de requêtes/vues.
Axe X (Temps) : Chronologie (Mois/Semaines).
Légende : Chaque couleur représente une langue distincte (par exemple, hindi = bleu, espagnol = rouge).
Perspicacité: Cette visualisation révèle la volatilité et la croissance. Une ligne plate indique une stagnation ; un pic indique une campagne réussie ou un événement viral dans cette région.
3. Contrôles de granularité (filtres temporels)
Zoom sur les données.
Vous pouvez ajuster la résolution des données à l'aide du menu déroulant dans le coin supérieur droit :
| Filtrer | Cas d'utilisation |
|---|---|
| Quotidien | Débogage : Le trafic a-t-il chuté à zéro hier ? (Problème DNS potentiel). |
| Hebdomadaire | Suivi des campagnes : Suivi de l'impact immédiat d'une nouvelle publicité localisée. |
| Mensuel | Rapports de performance : Rapports de haut niveau pour les parties prenantes. |
| Annuel | Saisonnalité : Identification des tendances à long terme (par exemple, le trafic allemand culmine en décembre). |
4. Intelligence stratégique
Transformer les données en décisions.
Validation du marché
Si vous constatez une augmentation significative du trafic espagnol en septembre 2025, cela validera que votre localisation en espagnol apporte une réelle valeur ajoutée. Vous pourriez alors envisager d'ajouter plus de contenu pour cette région.
Allocation des ressources
Si l'allemand a zéro requêtes pendant six mois, vous pourriez envisager de le déprécier ou d'enquêter si le sélecteur de langue est défectueux pour les utilisateurs allemands.
Surveillance SEO
Une augmentation soudaine et soutenue d'une langue spécifique indique souvent que Google a commencé à indexer vos sous-répertoires traduits (par ex. /hi/ ) pour cette région.